| POS | TEAM | CHANGE |
| 1 | ASTON VILLA | 81% |
| 2 | WEST HAM UTD | 41% |
| 3 | BRIGHTON & HOVE ALBION | 40% |
| 4 | CHELSEA | 32% |
| 5 | EVERTON | 16% |
| 6 | LEICESTER CITY | 15% |
| 7 | TOTTENHAM HOTSPUR | 14% |
| 8 | CRYSTAL PALACE | 3% |
| 9 | ARSENAL | -3% |
| 10 | LIVERPOOL | -4% |
| 11 | SOUTHAMPTON | -5% |
| 12 | MANCHESTER UTD | -6% |
| 13 | NEWCASTLE UTD | -10% |
| 14 | BURNLEY | -16% |
| 15 | WOLVERHAMPTON WANDERERS | -20% |
| 16 | MANCHESTER CITY | -26% |
| 17 | SHEFFIELD UTD | -44% |
Aston Villa claimed top spot back this week after taking four points from their games against Burnley and West Brom while West Ham fell to second following their 3-0 loss to Chelsea. Spurs plummeted from fourth to seventh, losing 16% along the way, due to their two defeats at the hands of Liverpool and Leicester.
At the other end of the table, Burnley climbed one place and increased their total by 8% after their two positive results against Villa and Wolves. The Clarets could find themselves climbing higher yet as they head into coming games against Leeds, Sheffield Utd and Fulham in strong form. It wouldn’t be surprising to see Sean Dyche’s side rise to match their performance from last season as he continues to work wonders in Lancashire.
Championship Rankings Arrive
The big news this week is that the EFL Championship Change Rankings table is finished and now viewable on the Change Rankings homepage beneath the Premier League table.
As it stands:
| POS | TEAM | CHANGE |
| 1 | READING | 37% |
| 2 | SWANSEA CITY | 31% |
| 3 | BARNSLEY | 28% |
| 4 | MIDDLESBROUGH | 25% |
| 5 | LUTON TOWN | 15% |
| 6 | STOKE CITY | 14% |
| 7 | CARDIFF CITY | 13% |
| 8 | BLACKBURN ROVERS | 12% |
| 9 | BRISTOL CITY | 7% |
| 10 | BRENTFORD | 1% |
| 11 | HUDDERSFIELD TOWN | 0% |
| 12 | BIRMINGHAM CITY | 0% |
| 13 | PRESTON NORTH END | -5% |
| 14 | QUEENS PARK RANGERS | -8% |
| 15 | MILLWALL | -9% |
| 16 | NOTTINGHAM FOREST | -21% |
| 17 | DERBY COUNTY | -21% |
| 18 | SHEFFIELD WEDNESDAY | -22% |
Unsurprisingly, Reading find themselves top after a very strong start but there have also been fantastic performances so far from Swansea, Barnsley and Middlesbrough. Is Neil Warnock about to weave his promotion magic yet again?
I’m looking for help with the Championship rundown so if anyone would like to write a profile of their Championship team’s season so far, get in touch!
Adjusted Points Tables
Also new in this week are Adjusted Points Tables. The concept here is relatively simple and based entirely on each team’s directly corresponding fixtures from last season.
So, using Liverpool as an example, their 7-2 loss to Villa earlier this season gave them a -3 to their “Adjusted Points” as it was fixture from which they secured three points last season. Equally, their 1-1 draw away to City gave them a +1 as it was a fixture they lost last season.
In Liverpool’s case, they’ve still got a huge lead to eat into yet before anyone comes too close to catching them and with main rivals Manchester City (-4) still struggling to really impose themselves on games, Klopp’s side look to be in a great position right now. Most improved in the Premier League Result Adjusted Table are of course Aston Villa (+13). Dean Smith’s side’s rapid growth and improvement in performance currently has them finishing on 48 points, enough for a 13th place finish as it stands.
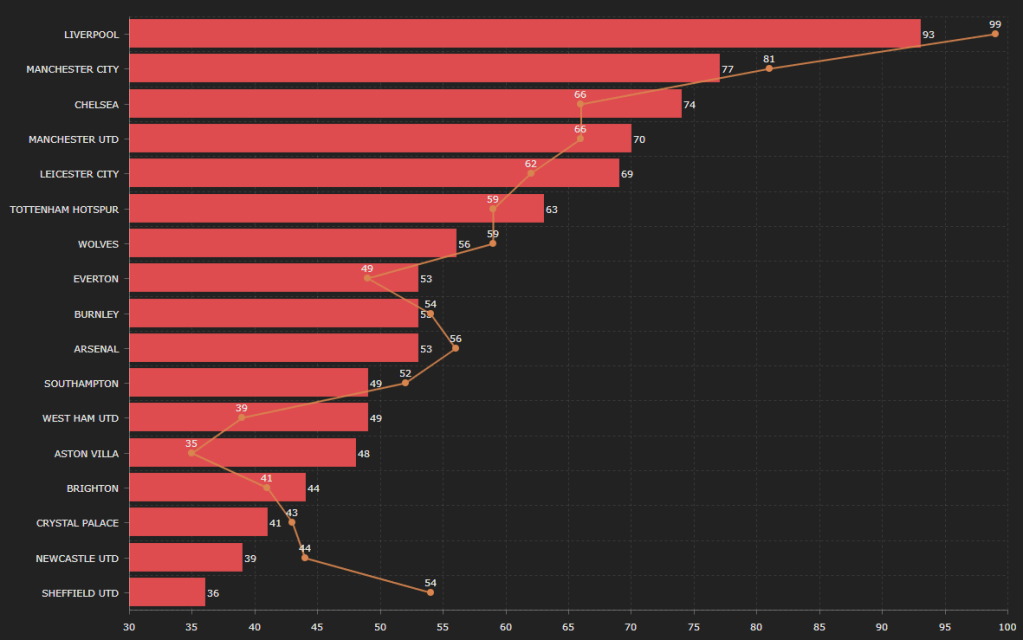
The race for the top four remains tight and for all the rave reviews that Spurs (+4) have generated so far, there is still a lot of improvement required if they are to catch the sides above them as Leicester City (+7), Manchester Utd (+4) and Chelsea (+8) all have equally or better improved points returns thus far.
Down at the bottom there’s little margin for error for Newcastle (-5) , Palace (-2) and Brighton (+3) as any significant decrease to last season’s returns could take them below the magic 40-point total. While Sheffield Utd (-18) would have to match last season’s results from here on to hit 36 points, enough to stay up by two points according to last season’s table… Tight!
All rights reserved. Jack Elderton. 2020. Statistical input taken from Wyscout & Fbref (Statsbomb).
